Renki Graphs

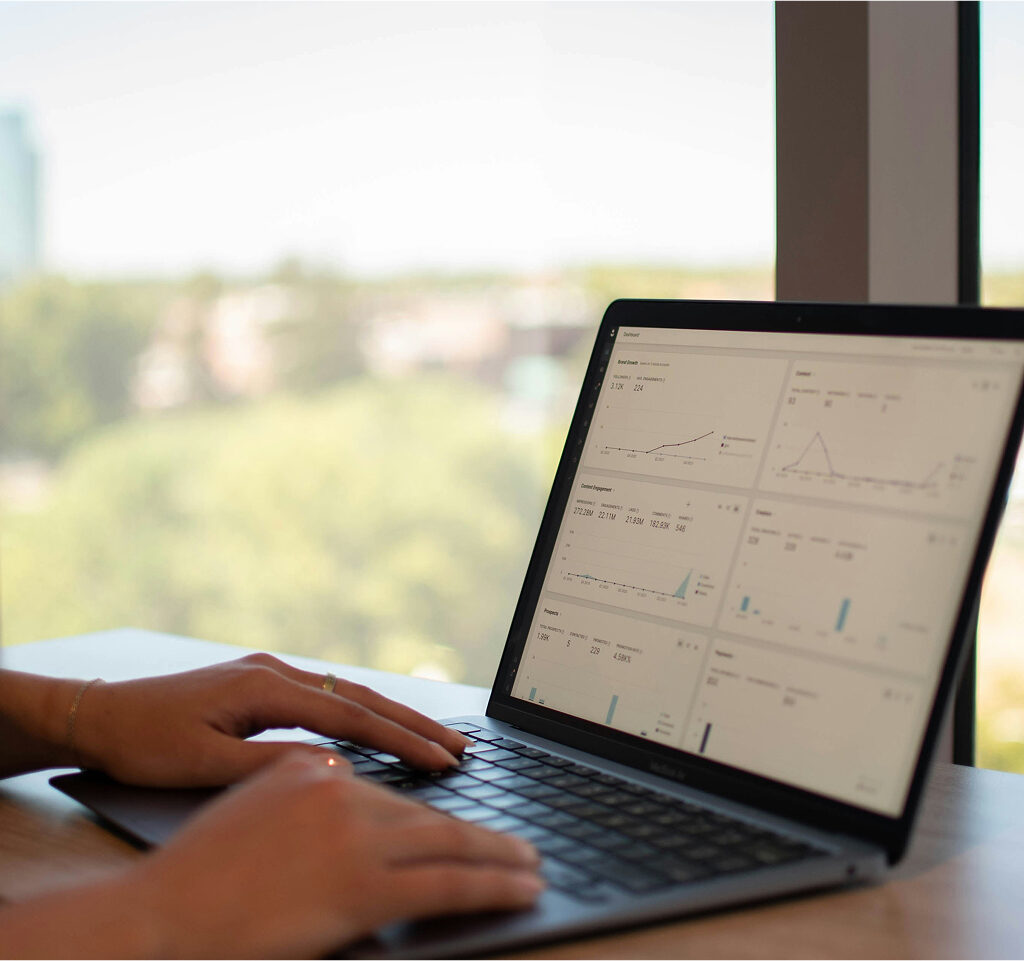
Real-Time Analytics & People Flow Tracking

Find out more

Renki’s Graphs feature provides visual analytics, helping users and operators understand people movement and device activity within a designated area. Graphs deliver real-time data and historical trends, enabling better space optimisation, resource management, and event monitoring.

How Does Renki Graphs Work?

Monitor people flow 
and movement

Analyse how people move through a specific area at different times.

Track active devices

Identify active devices within the service area without manual reporting.

Real-time and 
historical insights

Display current conditions or review long-term trends.

User-friendly
 visual reports

Automatically generated charts and analytics provide actionable insights without complex data tools.

Who Benefits from 
Renki Graphs?

  • Operators – Optimise space utilisation and monitor movement trends in service areas.
  • Event organisers – Track attendance numbers and analyse arrival and departure times.
  • Businesses – Gain insights into workspace usage without tracking individual employees.
  • Renki users – View personal activity data and understand how they interact with the service environment.

What Makes Renki Graphs Different?


Traditional people counters only provide numerical visitor counts.

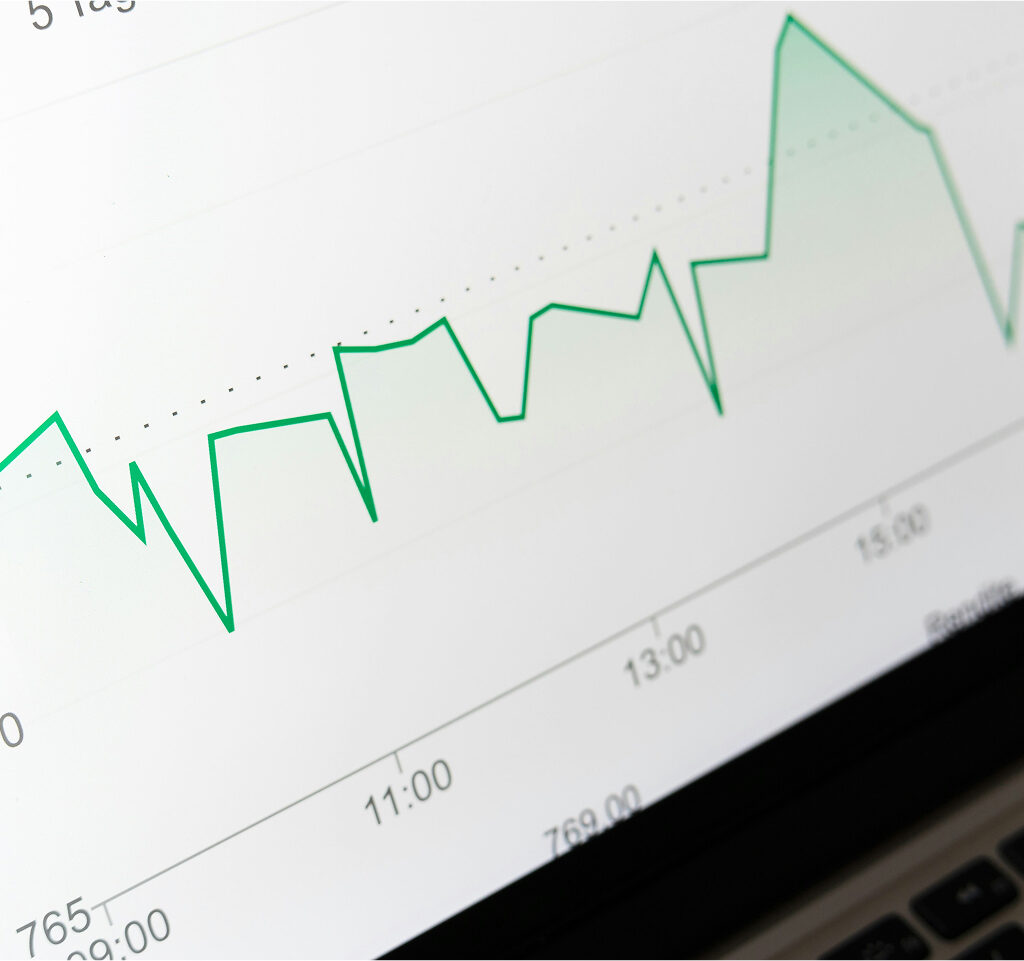
Renki Graphs allows you to visualise trends, movement patterns, and analyse other information for a much deeper insight.


Power BI requires manual reporting and data manipulation, taking time.

Renki Graphs automatically generates charts and analytics without any additional data processing.


Google Analytics focuses on online traffic and user profiling.

Renki Graphs measures physical movement and device activity in an anonymous, privacy-friendly way.

Data Privacy & GDPR Compliance

Renki Graphs is designed with user privacy in mind, ensuring that all data collection follows GDPR regulations and privacy best practices.

  • No personal tracking – Graphs analyse aggregated data, and no individual user information is collected or shared.
  • No individual profiling – All data is presented in group-level statistics, with no possibility of identifying a specific person.
  • User-controlled participation – Users can decide whether to share their attendance data, such as for event participation.
  • Fully GDPR-compliant – All data processing follows EU data protection laws, giving users full control over their information.

Make Data-Driven Decisions with Confidence

  • Understand user flow and optimise space usage more effectively.
  • Track active devices without personal profiling.
  • Analyse trends and improve services with real-time insights.

Renki Graphs makes data-driven decision-making effortless, while ensuring user privacy and full control over personal data.

We’re serious about protecting your data.

Your data is yours.

Your data always belongs to you. With Renki, you choose and control who has access to your data and when, with our extensive privacy access features.

GDPR Compliant

Any data you choose to share with Renki is stored with all the latest GDPR compliant methods in mind.

Bank-grade Encryption

All data shared within Renki is fully encrypted. We can’t read your information, and nobody else can either.